The present GlobalStat Data Dossier adopts a macro-regional perspective on the topics of the EUI’s 2021 State of the Union Conference on ‘Europe in a Changing World’. It highlights interesting trends in the areas discussed during the conference and has been created by the GlobalStat team to enhance the data-driven reflection on the state of global affairs and the global role of the EU. Therefore, data analysed point at challenges and opportunities for the EU within and for the EU’s role on the global stage. They should be assessed against the backdrop of the 2021 EUI SOU’s key questions related to strategic autonomy and geopolitical influence within global politics of today and tomorrow.
Gaby Umbach | Director, GlobalStat Igor Tkalec | Research Associate, GlobalStat
Introduction
The past years have witnessed an increasing contestation of global governance structures and a trend towards the re-nationalisation of politics. The erosion of the Paris Agreement, conflicts over burden-sharing in international security arrangements and new global trade wars are only some of the problems this development has nurtured. Other troubled areas are the shifts in global power constellations, the erosion of liberal democracies, the transformation of economic systems and the emergence of disruptive technologies. Therefore, the world seems to move towards new geopolitical and geo-economic patterns.
Against this overall transformative backdrop, the COVID-19 pandemic generates additional uncertainty at global level. According the World Uncertainty Index, COVID-19 is the most uncertain global event since the 1990s, followed by the US-China trade tensions, Brexit (2019), the European sovereign debt crisis and the US fiscal cliff (2012), as well as the war in Iraq and SARS outbreak (2003).
World Uncertainty Index
1990-2020, quarterly, GDP weighted average
The World Uncertainty Index is calculated for 143 countries. It is based on frequency counts of the word ‘uncertainty’ and its variants in the quarterly Economist Intelligence Unit (EIU) country reports, which discuss major economic and political developments. The raw frequency counts are scaled by the total number of words in each country report.
Artificial Intelligence and digitisation can serve as the foundation of growth-based prosperous and inclusive societies in the future. At the same time, they can significantly influence current socio-economic structures worldwide.
EU member states are embracing the advantages of the digital economy and of digital services. At the same time, they are faced with re-skilling challenges, a high risk of automation and a significant need for adaptation.
Top 3
EU
Estonia
Spain
Denmark
10.8
89
87
87
e-Government
score
Bottom 3
Slovakia
Greece
Romania
56
52
48
EU
10.8
e-Government score
Top 3
Estonia
Spain
Denmark
89
87
87
Bottom 3
Slovakia
Greece
Romania
56
52
48
EU member states’ preparedness for the fourth industrial revolution and the digital future constantly increased over the past years, according to the Digital Economy and Society Index (DESI). The score for the Digital Public Services (e-government) dimension of the index shows that Estonia (89.33), Spain (87.27) and Denmark (87.12) are the most developed in terms of e-government, while Slovakia (55.61), Greece (51.5) and Romania (48.4) are the least developed.
The DESI index consists of five dimensions: connectivity, human capital, use of internet, integration of digital technology, and digital public services.
The rise of Artificial Intelligence impacts the global economy in many ways. AI-related hiring is on an upward trend in many countries of the world. From 2016 to 2020, Brazil, India, Canada, Singapore, and South Africa experienced the highest growth in AI hiring.
Growth in AI Jobs
Index 2016 = 1, 2016-2020, %
Germany ranks 6th, Italy 12th, and France 13th among the countries analysed by the Stanford AI index in this category.
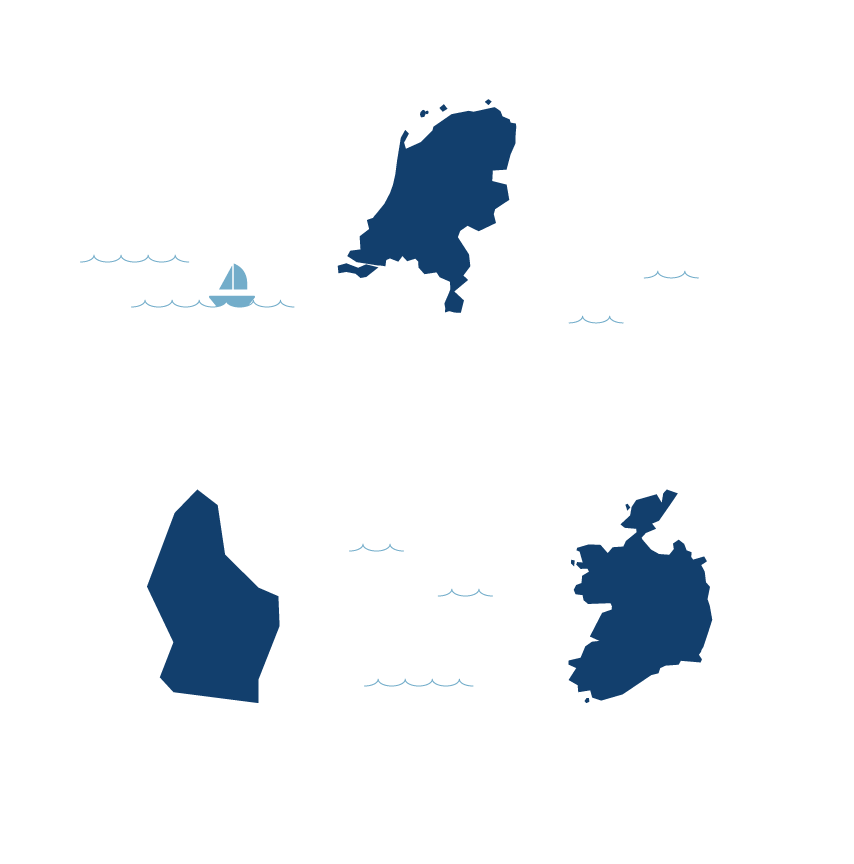
Exports of ICT services follow an upward global trend. The EU’s increased from 9.02% in 2005 to 12.69% in 2017, which is relatively high from a global and macro-regional perspective.
Israel, Kuwait and Ireland are global leaders in ICT services exports, each with over 40% of total services exports.
Exports of ICT goods (% of total goods exports) decreased both globally and within the EU (5.31% in 2019) since 2000. In 2019, Hong Kong was the global leader with 56.61% of total goods exports.
Europe & Central Asia (52) and North America (41) are in lead positions regarding the development of new corporate and institutional AI frameworks and principles, followed by East Asia & Pacific (14).
Yearly number of new AI ethics principles by region
Annual growth, 2015-2020
AI frameworks and principles represent normative approaches that deal with the ethical challenges of AI applications, including guidelines (i.e., privacy, accountability and transparency) and outlines that address concerns over AI development, deployment and governance.
Global CO2 emissions (from fuel combustion) increased from 23,241Mt in 2000 to 33,513Mt in 2018. Per capita emissions (from fuel combustion) increased from 3.8t in 2000 to 4.4t in 2018. While total emissions are an important indicator to identify key polluters in the fight against climate change, per capita emissions provide an assessment in terms of equity of the economic development of states.
In 2018, the biggest total emitters of CO2 are China (9957Mt), USA (5425Mt), India (2591Mt) and Russia (1691Mt). Germany is the biggest emitter within the EU. With 755Mt, it is the 7th largest emitter globally.
CO2 per capita emissions slightly increased from 4.17 ton CO2/cap in 2000 to 4.97 ton CO2/cap in 2018 globally. In EU28, per capita emissions decreased from 8.46 ton CO2/cap in 2000 to 6.78 ton CO2/cap in 2018. China has more than tripled its per capita emissions (7.95 ton CO2/cap in 2018) since 2000 (2.86 ton CO2/cap), while the US decreased from 20.98 in 2000 to 16.14 ton CO2/cap in 2018.
Climate change is arguably the most vital challenge the global community of states is facing. Global governance of this global common good is, as yet, highly contested and undermined by national interests.
CO2 emissions
Total emissions from fuel combustion (million tonnes of CO2) vs CO2 emissions / population (tonnes CO2 / capita), 2018
While those supporting the global climate change regime are still hopeful that the impact of global warming can be managed at least to some extent by timely human action, global carbon dioxide (CO2) emissions are projected to further increase, reaching the level of 40,000 million tonnes (Mt) by 2040. The graph below shows the relation between total emissions from fuel combustion and CO2 emissions per capita from fuel combustion in 2018.
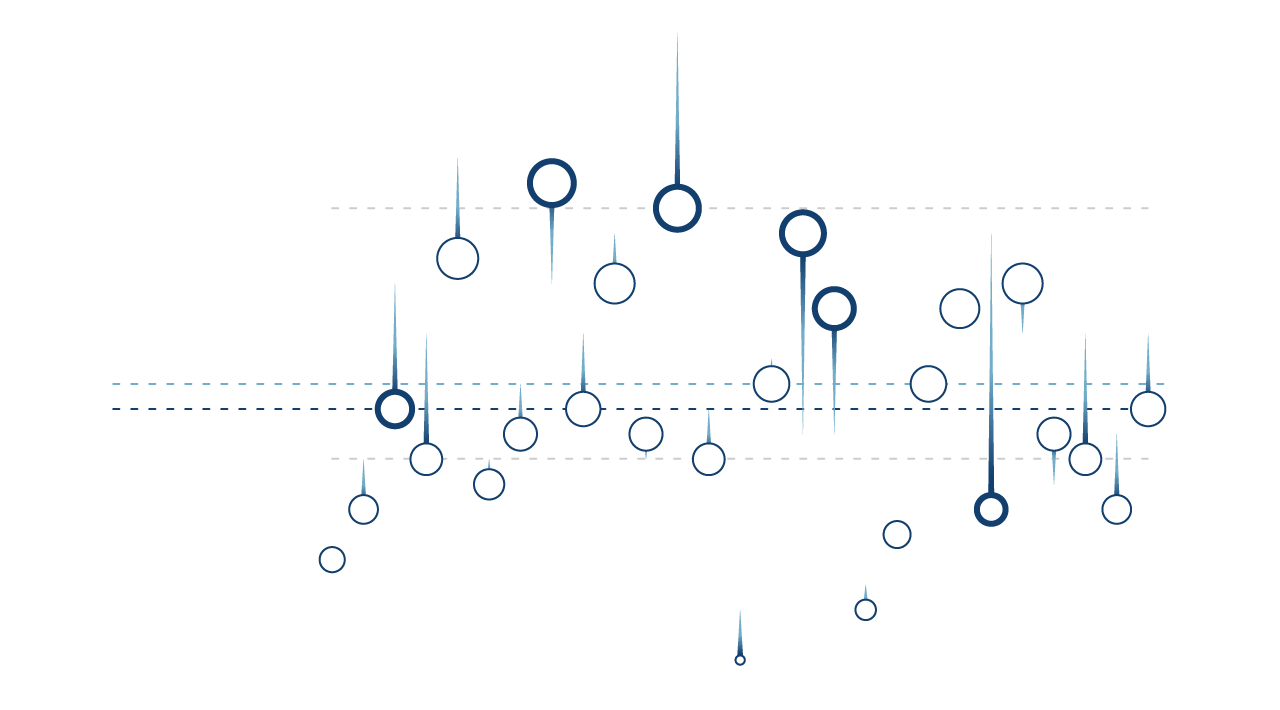
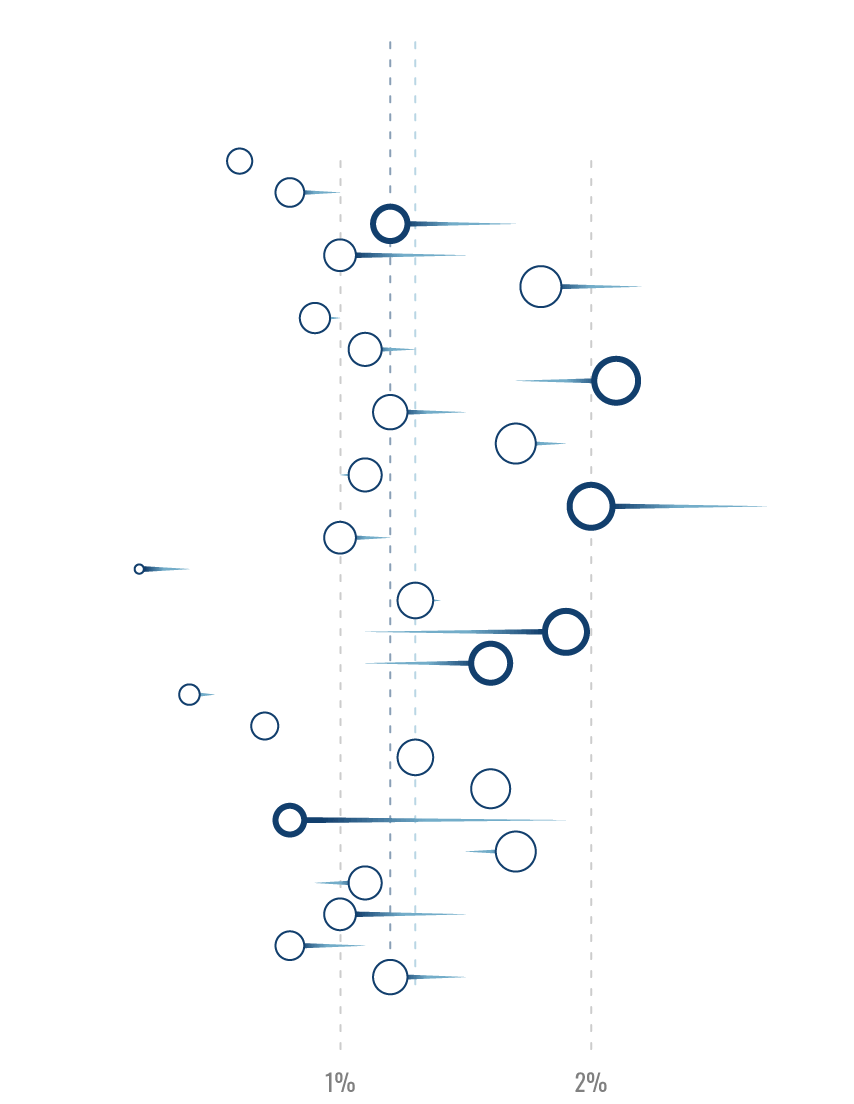
Environmental tax revenue within the EU has been rather constant over the past decade and stagnate at 2.37% of GDP in 2019. Following the assumption that revenue should decrease over time because of increased emissions reduction, stagnation seems to point at rather constant levels of total emissions within economic activities that fall under the environmental tax regime.
Environmental tax revenue consists of energy taxes, transport taxes and the sum of pollution and resource taxes. In 2019, Greece (3.86%), Croatia (3.54%) and the Netherlands (3.39%) had the highest revenues from environmental taxes in the EU.
There is a steady global progress in renewable energy generation. In 2019, 22.6% of all globally installed capacities for renewable energy generation were located in Europe.
Total renewable electricity generation
Per region, 2000-2018, GWh
Installed capacities for renewable energy generation in Asia have increased the most over time (31.6% of global total in 2010 to 44.19% in 2019). Top five countries include China, India, Japan, Vietnam and the South Korea.
Discriminatory/harmful state interventions affecting foreign commerce were prevalent in foreign trade over the past decade. Discriminatory/harmful state interventions peaked in 2018 (2388) and 2020 (2331). In those years there were 757 (2018) and 732 (2020) liberalising interventions.
China is the country most affected by discriminatory/harmful interventions (1304 interventions in total). However, China is also the country most affected by liberalising interventions (391 in total).
Liberalising policy instruments include tariff measures (40.6%), subsidies (excluding export subsidies) (22.3%), non-automatic licensing, quotas etc. (10.5%), export-related measures (including export subsidies) (9.3%), FDI measures (5.9%), and others (11.4%).
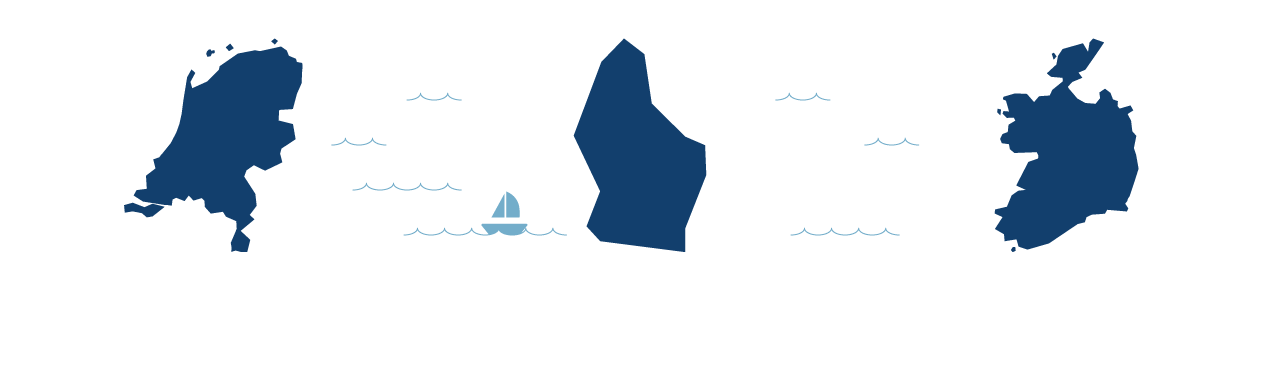
In the EU, the Netherlands (80), Luxembourg (74) and Ireland (77) are considered tax havens.
The Corporate Tax Haven Index consists of 20 indicators within 5 dimensions including lowest available corporate income tax, loopholes and gaps, transparency, anti-avoidance, double tax treaty aggressiveness.
The EU’s Recovery and Resilience Facility (RRF) amounts to €672.5 billion in loans and grants to support reforms and investments undertaken by EU member states to mitigate the economic and social fallout due to the COVID-19 pandemic.
NextGenerationEU breakdown
€ billion
Designed to stabilise the EU’s competitiveness at the global level after the COVID-19 pandemic, the EU’s multiannual financial framework (MFF) 2021-2027 together with the NextGenerationEU (COVID-19 recovery instrument that includes Recovery and Resilience Facility (RFF)) will be the largest stimulus package financed through the EU budget amounting to a total of €1.8 trillion.
As of 23 April 2021, 8.7 % of the EU population has received full vaccination against COVID-19, while 23.7% have only received the first dose. Malta (20%) and Hungary (18%) have the highest percentage of full vaccination uptake, while Bulgaria (2.5%) and Latvia (1.8%) have the lowest.
The national vaccine uptake is calculated as follows: number of first doses cumulatively administered to individuals 18 and above divided by the size of population aged 18+. It is expressed as a % of population aged 18+ years. Population data are obtained from Eurostat/UN.
The vaccine developed by Pfizer/BioNTech (Comirnaty) in the most widely distributed in all EU member states except for Latvia. The AstraZeneca vaccine is the second- most distributed.
According to European Parliament Public Opinion Monitoring, 70% of EU citizens would like to get COVID-19 vaccination at some point (if the vaccine was authorised by public authorities).
Since early 2021, public attitudes towards
COVID-19 vaccination are increasingly positive. In Denmark, Finland and Sweden COVID-19 vaccination has the highest approval rates.
Spending on defence accounted for 1.2% of EU-27 GDP in 2019and has been constant since 2013. Estonia (2.1%) and Greece (2%) spent the most on defence, while Ireland (0.2%) and Luxembourg (0.4%) spent the least.
In 2017, costs for personnel (48.8%) represent the largest share of defence spending, followed by operation and maintenance costs (27.2%), R&D (20.6%), and infrastructure/construction expenditures (2.7%). Defence as a sector is only the seventh largest expenditure component within the EU-27 (after social protection, health, public services, education, economic affairs and public safety).
At aggregate level, companies located in the USA, Japan and the UK sell the highest amounts of arms and military services. At individual company level, in 2018, US- based companies General Electric (121,615 mil. US$) and Boeing (101,126 mil. US$) led arms- and military services sales. They were followed by the trans-European Airbus Group (75,195 mil. US$). Within the EU, French- (Safran 24,846 mil. US$) and German-based companies (ThyssenKrupp 50,400 mil. US$) based companies are the biggest sellers followed by Italian-based company Leonardo (14,447 mil. US$).
Top 100 arms-producing and military services companies in the world
Total sales arms sales, excluding China, 2018, US$ million
In 2019, before the COVID-19 pandemic, four EU-27 member states – the Netherlands (82.4), Germany (81.8), Sweden (81.2), and Denmark (81.2) – were among the 10 most competitive economies in the world. Persistently low nominal unit labour costs and increasing exports of goods and services are factors that underpin competitiveness, especially in the EU context. The two most competitive economies in the world are Singapore (84.8) and the USA (83.7). Least competitive countries are the Democratic Republic of the Congo (36.1), Yemen (35.5) and Chad (35.1).
Singapore
United
States
Hong Kong
SAR
Netherlands
Japan
84.8
83.7
83.1
82.4
82.3
Switzerland
Germany
Denmark
Sweden
United
Kingdom
82.3
81.8
81.2
81.2
81.2
Singapore
United
States
Hong Kong
SAR
84.8
83.7
83.1
Netherlands
Japan
Switzerland
82.4
82.3
82.3
Germany
Denmark
Sweden
81.8
81.2
81.2
United
Kingdom
81.2
Competitiveness is defined by attributes and quality of an economy that allow for a more efficient use of factors production. The Global Competitive Index includes four dimensions: enabling environment (institutions, infrastructure, ICT adoption, macroeconomic stability), human capital (health, skills), markets (product market, labour market, financial system, market size), and innovation ecosystem (business dynamism and innovation capability).
In terms of post-pandemic transformation readiness, the WEF 2020 Global Competitive Report ranks ten EU member states (in ranking order: Estonia, Denmark, the Netherlands, Finland, Sweden, Portugal, Spain, Ireland, Hungary and the Slovak Republic) among the first ten countries best equipped to upgrade infrastructure to accelerate the energy transition and broaden access to electricity and ICT. Contrary to this front-runner position, only three EU member states (Ireland, France and Germany) are among the ten nations assessed able to shift to a more progressive taxation, rethinking how corporations’ wealth and labour are taxed nationally and in an international cooperative framework. Only four EU member states (Finland, Sweden , the Netherlands, France) rank among the ten states best equipped to facilitate the creation of ‘markets of tomorrow’, especially in areas that require public-private collaboration.
Although the EU is performing well in both areas, its expenditure on research and development (R&D) requires an increase in order to transform R&D into a true growth generator that can sustainably boost the EU’s competitiveness at a global scale.
From 2008 to 2018, the EU increased its R&D expenditure by 16.5%.
R&D expenditure
2008-2018, % of GDP
Although R&D expenditure has increased since 2008, and in 2018 equals 2.18% of GDP, the EU still lags behind the USA (2.82%), and Japan (3.28%). In 2018, the EU managed to surpass China (2.14%; excluding Hong Kong) in R&D spending.
Ates, L., A. Cobham, M. Harari, P. Jansky, M. Meinzer, L. Millan-Narotzky, and M. Palansky. 2021. ‘The Corporate Tax Haven Index: A New Geography of Profit Shifting’. In Combatting Fiscal Fraud and Impowering Regulators, edited by B. Unger, L. Russel, and J. Ferwerda. Oxford, UK: Oxford University Press.
European Commission. n.d. ‘DESI Composite Index — Digital Scoreboard - Data & Indicators’. Accessed 12 April 2021a. https://digital-agenda-data.eu/charts/desi-composite#chart={%22indicator%22:%22desi_sliders%22,%22breakdown%22:{%22desi_1_conn%22:5,%22desi_2_hc%22:5,%22desi_3_ui%22:3,%22desi_4_idt%22:4,%22desi_5_dps%22:3},%22unit-measure%22:%22pc_desi_sliders%22,%22time-period%22:%222020%22}.
Global Trade Alert. n.d. ‘Monitoring of Policies That Affect World Commerce - All State Interventions since the Start of the Global Financial Crisis’. Accessed 12 April 2021. https://www.globaltradealert.org/.
HAI. 2021. ‘Artificial Intelligence Index Report 2021’. HAI Stanford University Human-Centered Artificial Intelligence.
IRENA. n.d. ‘International Renewable Energy Agency - Trends in Renewable Energy by Region’. /Statistics/View-Data-by-Topic/Capacity-and-Generation/Regional-Trends. Accessed 12 April 2021. /Statistics/View-Data-by-Topic/Capacity-and-Generation/Regional-Trends.
OECD. 2018. ‘Putting Faces to the Jobs of Risk of Automation’. Policy Brief on the Future of Work.
Schwab, Klaus. 2019. ‘The Global Competitiveness Report 2019’. Insight Report. Cologny/Geneva: World Economic Forum.
Schwab, Klaus, and Saadia Zahidi. 2020. ‘The Global Competitiveness Report - Special Edition 2020 - How Countries Are Performing on the Road to Recovery’. Cologny/Geneva: World Economic Forum.
GlobalStat Global Governance Programme Robert Schuman Centre for Advanced Studies European University Institute Via Boccaccio, 121 50133 Florence Italy
Robert Schuman Centre for Advanced Studies The Robert Schuman Centre for Advanced Studies (RSCAS), created in 1992 and directed by Professor Brigid Laffan, aims to develop inter-disciplinary and comparative research on the major issues facing the process of European integration, European societies and Europe’s place in 21st century global politics. The Centre is home to a large post-doctoral programme and hosts major research programmes, projects and data sets, in addition to a range of working groups and ad hoc initiatives. The research agenda is organised around a set of core themes and is continuously evolving, reflecting the changing agenda of European integration, the expanding membership of the European Union, developments in Europe’s neighbourhood and the wider world.
Global Governance Programme The Global Governance Programme (GGP) is research turned into action. It provides a European setting to conduct research at the highest level and promote synergies between the worlds of research and policy-making, to generate ideas and identify creative an innovative solutions to global challenges. Th e Programme is part of the Robert Schuman Centre for Advanced Studies of the European University Institute, a world-renowned academic institution. It receives financial support from the European Commission through the European Union budget. Complete information on our activities can be found online at: globalgovernanceprogramme.eui.eu
Views expressed in this publication reflect the opinion of individual authors and not those of the European University Institute or the European Commission.
 Artificial Intelligence and Digital Economy


 Climate
 Global Economy and Multilateralism


 Public Health


 Peace, Security and Human Rights
 Strategic Autonomy